|
Download Data (XLS File) |
|
|||||
|
|||||
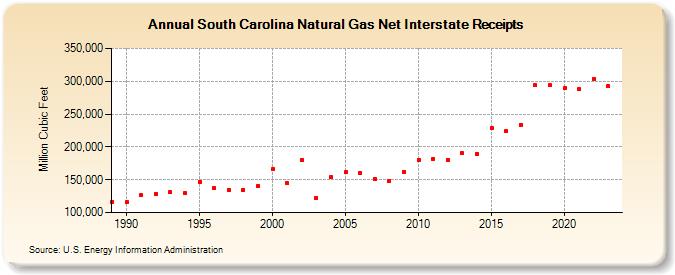
| South Carolina Natural Gas Net Interstate Receipts (Million Cubic Feet) | |||||
| Decade | Year-0 | Year-1 | Year-2 | Year-3 | Year-4 | Year-5 | Year-6 | Year-7 | Year-8 | Year-9 |
|---|---|---|---|---|---|---|---|---|---|---|
| 1980's | 116,696 | |||||||||
| 1990's | 115,357 | 126,562 | 128,868 | 130,670 | 129,772 | 147,041 | 137,366 | 134,208 | 134,395 | 141,038 |
| 2000's | 165,868 | 144,448 | 180,550 | 122,701 | 153,623 | 161,300 | 160,888 | 151,632 | 148,737 | 162,275 |
| 2010's | 180,604 | 181,941 | 180,428 | 190,460 | 189,599 | 228,826 | 223,759 | 233,812 | 293,830 | 293,729 |
| 2020's | 289,181 | 287,513 | 303,803 | 292,034 | 290,447 |
| - = No Data Reported; -- = Not Applicable; NA = Not Available; W = Withheld to avoid disclosure of individual company data. |
| Release Date: 6/30/2026 |
| Next Release Date: 7/31/2026 |