|
Download Data (XLS File) |
|
|||||
|
|||||
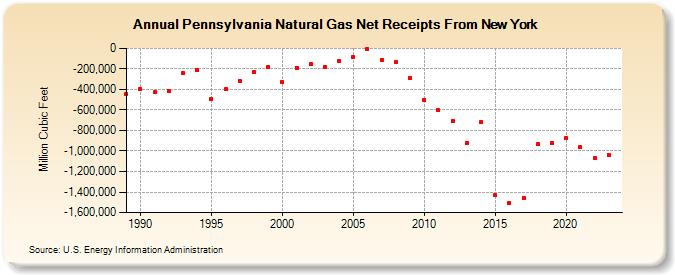
| Pennsylvania Natural Gas Net Receipts From New York (Million Cubic Feet) | |||||
| Decade | Year-0 | Year-1 | Year-2 | Year-3 | Year-4 | Year-5 | Year-6 | Year-7 | Year-8 | Year-9 |
|---|---|---|---|---|---|---|---|---|---|---|
| 1980's | -443,915 | |||||||||
| 1990's | -400,619 | -427,386 | -412,245 | -244,263 | -210,109 | -494,457 | -398,241 | -314,416 | -231,964 | -185,597 |
| 2000's | -329,636 | -188,464 | -155,147 | -177,893 | -121,257 | -88,514 | -6,412 | -109,584 | -136,091 | -285,899 |
| 2010's | -504,385 | -603,843 | -710,728 | -917,927 | -720,546 | -1,432,218 | -1,504,557 | -1,453,857 | -935,862 | -924,400 |
| 2020's | -873,145 | -965,366 | -1,072,555 | -1,035,222 | -1,066,333 |
| - = No Data Reported; -- = Not Applicable; NA = Not Available; W = Withheld to avoid disclosure of individual company data. |
| Release Date: 6/30/2026 |
| Next Release Date: 7/31/2026 |