|
Download Data (XLS File) |
|
|||||
|
|||||
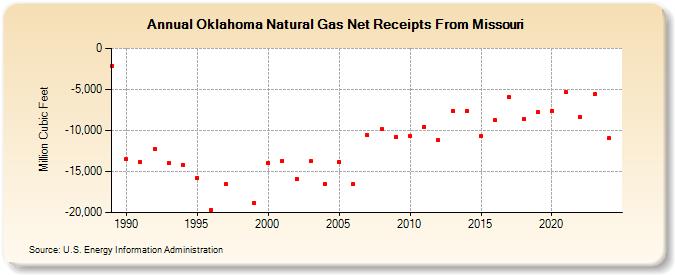
| Oklahoma Natural Gas Net Receipts From Missouri (Million Cubic Feet) | |||||
| Decade | Year-0 | Year-1 | Year-2 | Year-3 | Year-4 | Year-5 | Year-6 | Year-7 | Year-8 | Year-9 |
|---|---|---|---|---|---|---|---|---|---|---|
| 1980's | -2,133 | |||||||||
| 1990's | -13,513 | -13,852 | -12,233 | -13,936 | -14,181 | -15,738 | -19,649 | -16,534 | -18,797 | |
| 2000's | -13,992 | -13,681 | -15,910 | -13,752 | -16,496 | -13,808 | -16,521 | -10,567 | -9,807 | -10,795 |
| 2010's | -10,683 | -9,541 | -11,196 | -7,596 | -7,578 | -10,724 | -8,775 | -5,956 | -8,615 | -7,760 |
| 2020's | -7,598 | -5,344 | -8,344 | -5,589 | -10,968 |
| - = No Data Reported; -- = Not Applicable; NA = Not Available; W = Withheld to avoid disclosure of individual company data. |
| Release Date: 6/30/2026 |
| Next Release Date: 7/31/2026 |