|
Download Data (XLS File) |
|
|||||
|
|||||
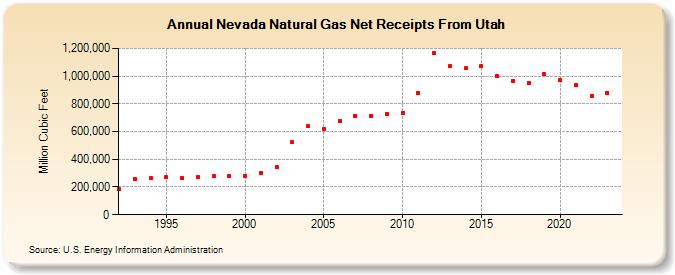
| Nevada Natural Gas Net Receipts From Utah (Million Cubic Feet) | |||||
| Decade | Year-0 | Year-1 | Year-2 | Year-3 | Year-4 | Year-5 | Year-6 | Year-7 | Year-8 | Year-9 |
|---|---|---|---|---|---|---|---|---|---|---|
| 1990's | 185,231 | 254,757 | 261,618 | 268,950 | 268,138 | 272,657 | 278,778 | 278,302 | ||
| 2000's | 282,834 | 303,262 | 341,853 | 522,004 | 637,427 | 618,745 | 678,327 | 715,782 | 712,834 | 729,331 |
| 2010's | 735,808 | 879,418 | 1,167,899 | 1,070,248 | 1,056,264 | 1,072,889 | 1,000,289 | 966,782 | 950,908 | 1,012,022 |
| 2020's | 971,423 | 937,154 | 856,945 | 880,378 | 779,857 |
| - = No Data Reported; -- = Not Applicable; NA = Not Available; W = Withheld to avoid disclosure of individual company data. |
| Release Date: 6/30/2026 |
| Next Release Date: 7/31/2026 |