|
Download Data (XLS File) |
|
|||||
|
|||||
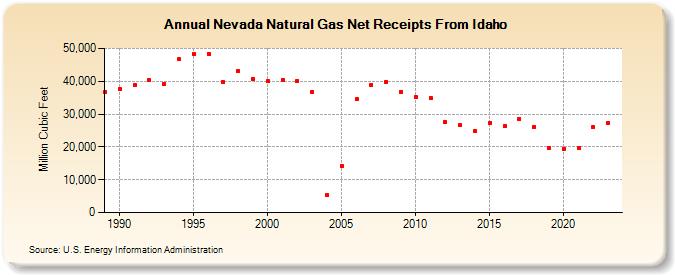
| Nevada Natural Gas Net Receipts From Idaho (Million Cubic Feet) | |||||
| Decade | Year-0 | Year-1 | Year-2 | Year-3 | Year-4 | Year-5 | Year-6 | Year-7 | Year-8 | Year-9 |
|---|---|---|---|---|---|---|---|---|---|---|
| 1980's | 36,703 | |||||||||
| 1990's | 37,634 | 38,803 | 40,293 | 39,197 | 46,691 | 48,377 | 48,442 | 39,742 | 43,092 | 40,727 |
| 2000's | 40,043 | 40,473 | 40,097 | 36,848 | 5,486 | 14,312 | 34,531 | 38,876 | 39,875 | 36,752 |
| 2010's | 35,193 | 34,829 | 27,558 | 26,583 | 24,866 | 27,244 | 26,331 | 28,625 | 26,063 | 19,680 |
| 2020's | 19,460 | 19,803 | 26,030 | 27,341 | 26,785 |
| - = No Data Reported; -- = Not Applicable; NA = Not Available; W = Withheld to avoid disclosure of individual company data. |
| Release Date: 6/30/2026 |
| Next Release Date: 7/31/2026 |