|
Download Data (XLS File) |
|
|||||
|
|||||
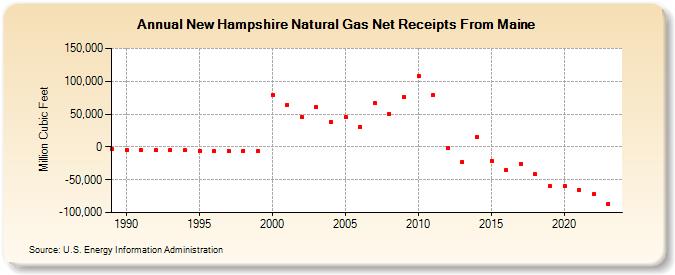
| New Hampshire Natural Gas Net Receipts From Maine (Million Cubic Feet) | |||||
| Decade | Year-0 | Year-1 | Year-2 | Year-3 | Year-4 | Year-5 | Year-6 | Year-7 | Year-8 | Year-9 |
|---|---|---|---|---|---|---|---|---|---|---|
| 1980's | -3,657 | |||||||||
| 1990's | -4,457 | -4,815 | -5,135 | -4,962 | -4,884 | -5,521 | -5,888 | -6,433 | -5,728 | -6,597 |
| 2000's | 79,367 | 64,541 | 45,595 | 60,675 | 38,634 | 45,349 | 30,419 | 66,082 | 50,407 | 76,407 |
| 2010's | 108,332 | 78,658 | -991 | -22,985 | 15,091 | -21,061 | -35,556 | -25,741 | -41,824 | -59,706 |
| 2020's | -59,280 | -65,492 | -72,000 | -86,278 | -99,149 |
| - = No Data Reported; -- = Not Applicable; NA = Not Available; W = Withheld to avoid disclosure of individual company data. |
| Release Date: 6/30/2026 |
| Next Release Date: 7/31/2026 |