|
Download Data (XLS File) |
|
|||||
|
|||||
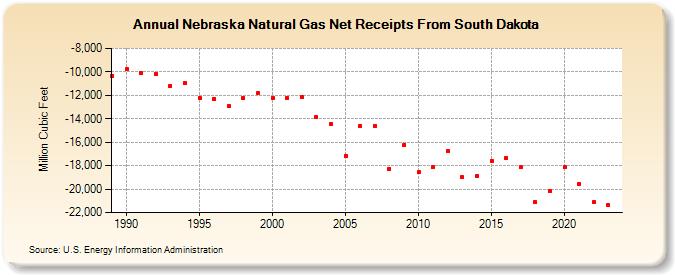
| Nebraska Natural Gas Net Receipts From South Dakota (Million Cubic Feet) | |||||
| Decade | Year-0 | Year-1 | Year-2 | Year-3 | Year-4 | Year-5 | Year-6 | Year-7 | Year-8 | Year-9 |
|---|---|---|---|---|---|---|---|---|---|---|
| 1980's | -10,359 | |||||||||
| 1990's | -9,764 | -10,111 | -10,188 | -11,198 | -10,962 | -12,209 | -12,316 | -12,951 | -12,210 | -11,817 |
| 2000's | -12,222 | -12,230 | -12,154 | -13,888 | -14,437 | -17,143 | -14,612 | -14,577 | -18,260 | -16,207 |
| 2010's | -18,566 | -18,118 | -16,773 | -18,996 | -18,881 | -17,571 | -17,363 | -18,154 | -21,106 | -20,133 |
| 2020's | -18,117 | -19,560 | -21,117 | -21,368 | -20,831 |
| - = No Data Reported; -- = Not Applicable; NA = Not Available; W = Withheld to avoid disclosure of individual company data. |
| Release Date: 6/30/2026 |
| Next Release Date: 7/31/2026 |