|
Download Data (XLS File) |
|
|||||
|
|||||
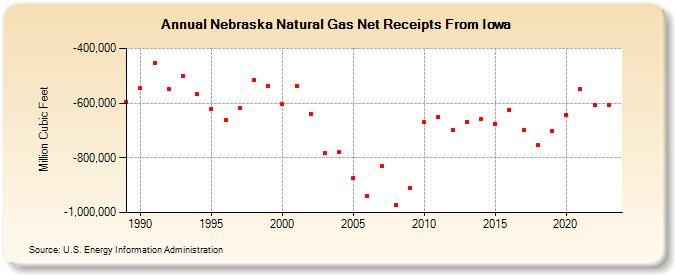
| Nebraska Natural Gas Net Receipts From Iowa (Million Cubic Feet) | |||||
| Decade | Year-0 | Year-1 | Year-2 | Year-3 | Year-4 | Year-5 | Year-6 | Year-7 | Year-8 | Year-9 |
|---|---|---|---|---|---|---|---|---|---|---|
| 1980's | -596,798 | |||||||||
| 1990's | -545,561 | -453,603 | -547,031 | -499,930 | -568,064 | -620,120 | -661,704 | -618,269 | -515,531 | -536,276 |
| 2000's | -602,691 | -536,127 | -638,417 | -782,544 | -780,231 | -875,075 | -937,909 | -829,967 | -971,053 | -909,777 |
| 2010's | -669,225 | -650,719 | -697,885 | -670,486 | -658,391 | -676,985 | -623,343 | -699,214 | -754,053 | -701,835 |
| 2020's | -641,894 | -548,447 | -606,617 | -607,721 | -635,053 |
| - = No Data Reported; -- = Not Applicable; NA = Not Available; W = Withheld to avoid disclosure of individual company data. |
| Release Date: 6/30/2026 |
| Next Release Date: 7/31/2026 |