|
Download Data (XLS File) |
|
|||||
|
|||||
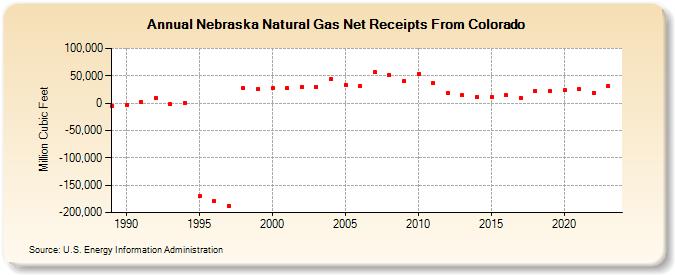
| Nebraska Natural Gas Net Receipts From Colorado (Million Cubic Feet) | |||||
| Decade | Year-0 | Year-1 | Year-2 | Year-3 | Year-4 | Year-5 | Year-6 | Year-7 | Year-8 | Year-9 |
|---|---|---|---|---|---|---|---|---|---|---|
| 1980's | -4,836 | |||||||||
| 1990's | -2,548 | 1,875 | 9,559 | -2,130 | 947 | -170,599 | -178,940 | -188,153 | 27,003 | 25,445 |
| 2000's | 26,784 | 27,298 | 29,863 | 30,076 | 43,542 | 33,705 | 30,588 | 56,134 | 51,887 | 40,264 |
| 2010's | 53,709 | 36,003 | 19,220 | 14,188 | 11,342 | 11,592 | 14,176 | 9,617 | 22,115 | 21,941 |
| 2020's | 23,271 | 24,967 | 18,991 | 31,077 | 29,696 |
| - = No Data Reported; -- = Not Applicable; NA = Not Available; W = Withheld to avoid disclosure of individual company data. |
| Release Date: 6/30/2026 |
| Next Release Date: 7/31/2026 |