|
Download Data (XLS File) |
|
|||||
|
|||||
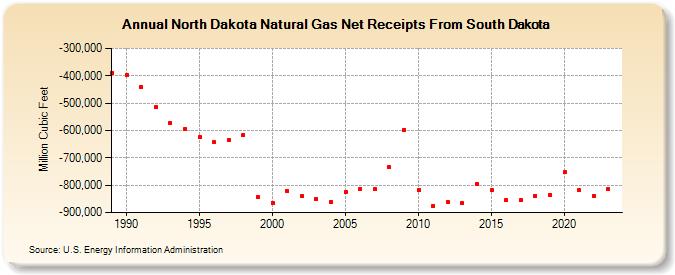
| North Dakota Natural Gas Net Receipts From South Dakota (Million Cubic Feet) | |||||
| Decade | Year-0 | Year-1 | Year-2 | Year-3 | Year-4 | Year-5 | Year-6 | Year-7 | Year-8 | Year-9 |
|---|---|---|---|---|---|---|---|---|---|---|
| 1980's | -388,332 | |||||||||
| 1990's | -396,842 | -440,399 | -514,901 | -571,848 | -594,199 | -624,457 | -643,401 | -633,621 | -616,740 | -843,280 |
| 2000's | -863,254 | -820,723 | -838,671 | -849,922 | -861,235 | -824,743 | -812,511 | -813,970 | -734,956 | -596,589 |
| 2010's | -817,804 | -875,793 | -860,536 | -865,196 | -793,807 | -816,831 | -854,237 | -854,705 | -839,000 | -834,237 |
| 2020's | -752,698 | -818,965 | -837,936 | -814,176 | -834,904 |
| - = No Data Reported; -- = Not Applicable; NA = Not Available; W = Withheld to avoid disclosure of individual company data. |
| Release Date: 6/30/2026 |
| Next Release Date: 7/31/2026 |