|
Download Data (XLS File) |
|
|||||
|
|||||
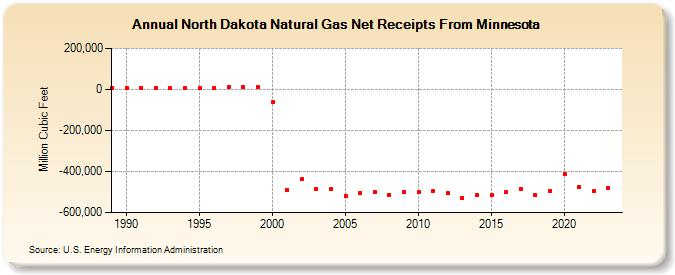
| North Dakota Natural Gas Net Receipts From Minnesota (Million Cubic Feet) | |||||
| Decade | Year-0 | Year-1 | Year-2 | Year-3 | Year-4 | Year-5 | Year-6 | Year-7 | Year-8 | Year-9 |
|---|---|---|---|---|---|---|---|---|---|---|
| 1980's | 7,190 | |||||||||
| 1990's | 7,135 | 8,261 | 7,886 | 6,092 | 6,422 | 8,184 | 8,157 | 9,984 | 10,796 | 9,988 |
| 2000's | -62,609 | -489,338 | -438,856 | -484,198 | -484,010 | -518,366 | -502,976 | -499,096 | -514,385 | -500,934 |
| 2010's | -499,136 | -493,070 | -506,315 | -530,080 | -514,265 | -516,574 | -497,749 | -487,583 | -512,359 | -495,827 |
| 2020's | -414,419 | -474,359 | -494,950 | -479,187 | -497,619 |
| - = No Data Reported; -- = Not Applicable; NA = Not Available; W = Withheld to avoid disclosure of individual company data. |
| Release Date: 6/30/2026 |
| Next Release Date: 7/31/2026 |