|
Download Data (XLS File) |
|
|||||
|
|||||
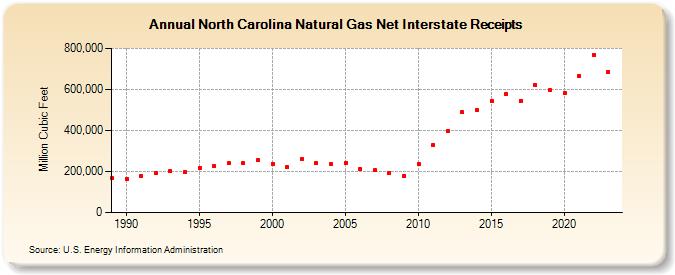
| North Carolina Natural Gas Net Interstate Receipts (Million Cubic Feet) | |||||
| Decade | Year-0 | Year-1 | Year-2 | Year-3 | Year-4 | Year-5 | Year-6 | Year-7 | Year-8 | Year-9 |
|---|---|---|---|---|---|---|---|---|---|---|
| 1980's | 166,617 | |||||||||
| 1990's | 165,794 | 176,643 | 191,486 | 202,188 | 198,606 | 217,693 | 226,797 | 239,413 | 240,980 | 255,366 |
| 2000's | 238,304 | 221,061 | 261,322 | 240,370 | 234,705 | 241,417 | 212,224 | 205,096 | 192,853 | 180,003 |
| 2010's | 235,607 | 329,968 | 396,974 | 488,320 | 497,802 | 543,833 | 576,220 | 545,883 | 620,787 | 595,836 |
| 2020's | 581,973 | 666,699 | 769,574 | 686,313 | 720,657 |
| - = No Data Reported; -- = Not Applicable; NA = Not Available; W = Withheld to avoid disclosure of individual company data. |
| Release Date: 6/30/2026 |
| Next Release Date: 7/31/2026 |