|
Download Data (XLS File) |
|
|||||
|
|||||
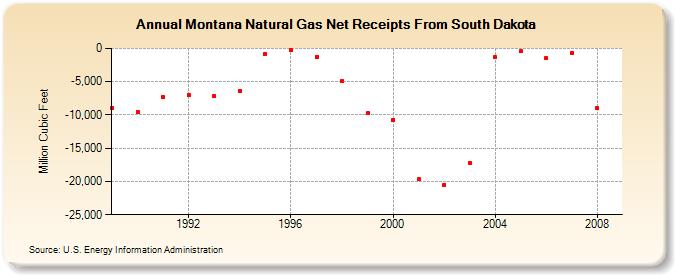
| Montana Natural Gas Net Receipts From South Dakota (Million Cubic Feet) | |||||
| Decade | Year-0 | Year-1 | Year-2 | Year-3 | Year-4 | Year-5 | Year-6 | Year-7 | Year-8 | Year-9 |
|---|---|---|---|---|---|---|---|---|---|---|
| 1980's | -9,001 | |||||||||
| 1990's | -9,492 | -7,312 | -6,969 | -7,187 | -6,439 | -837 | -266 | -1,260 | -4,908 | -9,786 |
| 2000's | -10,768 | -19,672 | -20,485 | -17,188 | -1,364 | -458 | -1,483 | -620 | -9,033 |
| - = No Data Reported; -- = Not Applicable; NA = Not Available; W = Withheld to avoid disclosure of individual company data. |
| Release Date: 6/30/2026 |
| Next Release Date: 7/31/2026 |