|
Download Data (XLS File) |
|
|||||
|
|||||
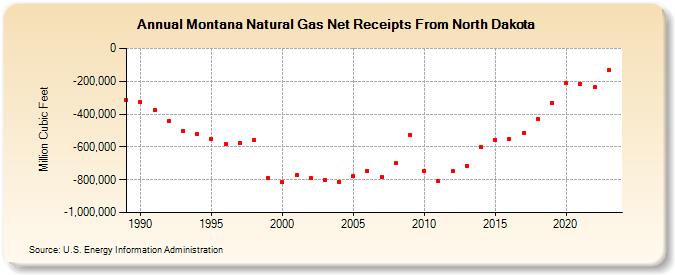
| Montana Natural Gas Net Receipts From North Dakota (Million Cubic Feet) | |||||
| Decade | Year-0 | Year-1 | Year-2 | Year-3 | Year-4 | Year-5 | Year-6 | Year-7 | Year-8 | Year-9 |
|---|---|---|---|---|---|---|---|---|---|---|
| 1980's | -316,668 | |||||||||
| 1990's | -325,020 | -372,443 | -444,277 | -502,211 | -524,191 | -554,689 | -579,598 | -577,068 | -557,185 | -790,088 |
| 2000's | -816,481 | -773,589 | -789,644 | -800,267 | -813,833 | -778,351 | -746,968 | -782,332 | -700,560 | -525,630 |
| 2010's | -744,665 | -809,589 | -747,469 | -717,278 | -601,034 | -557,402 | -551,185 | -513,211 | -428,944 | -335,253 |
| 2020's | -213,655 | -216,655 | -236,749 | -133,163 | -98,417 |
| - = No Data Reported; -- = Not Applicable; NA = Not Available; W = Withheld to avoid disclosure of individual company data. |
| Release Date: 6/30/2026 |
| Next Release Date: 7/31/2026 |