|
Download Data (XLS File) |
|
|||||
|
|||||
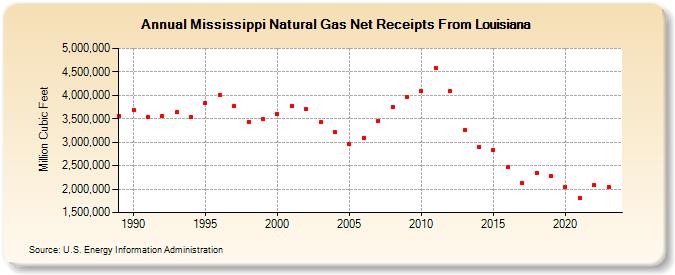
| Mississippi Natural Gas Net Receipts From Louisiana (Million Cubic Feet) | |||||
| Decade | Year-0 | Year-1 | Year-2 | Year-3 | Year-4 | Year-5 | Year-6 | Year-7 | Year-8 | Year-9 |
|---|---|---|---|---|---|---|---|---|---|---|
| 1980's | 3,565,302 | |||||||||
| 1990's | 3,696,538 | 3,529,448 | 3,549,374 | 3,636,308 | 3,535,661 | 3,836,109 | 4,006,173 | 3,771,277 | 3,437,300 | 3,493,818 |
| 2000's | 3,595,975 | 3,776,499 | 3,702,133 | 3,422,127 | 3,209,827 | 2,955,432 | 3,091,833 | 3,454,639 | 3,745,265 | 3,967,501 |
| 2010's | 4,091,462 | 4,584,485 | 4,081,247 | 3,264,961 | 2,906,776 | 2,838,813 | 2,461,201 | 2,133,333 | 2,339,745 | 2,273,687 |
| 2020's | 2,053,760 | 1,817,835 | 2,087,394 | 2,047,635 | 2,094,082 |
| - = No Data Reported; -- = Not Applicable; NA = Not Available; W = Withheld to avoid disclosure of individual company data. |
| Release Date: 6/30/2026 |
| Next Release Date: 7/31/2026 |