|
Download Data (XLS File) |
|
|||||
|
|||||
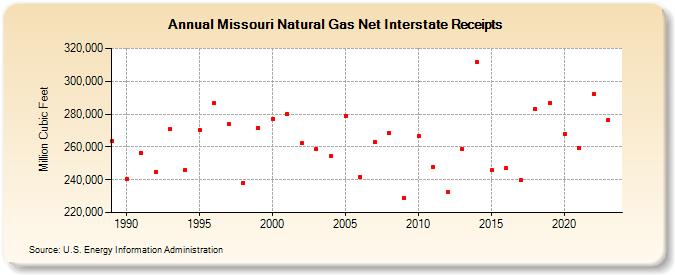
| Missouri Natural Gas Net Interstate Receipts (Million Cubic Feet) | |||||
| Decade | Year-0 | Year-1 | Year-2 | Year-3 | Year-4 | Year-5 | Year-6 | Year-7 | Year-8 | Year-9 |
|---|---|---|---|---|---|---|---|---|---|---|
| 1980's | 263,357 | |||||||||
| 1990's | 240,401 | 256,332 | 244,630 | 270,752 | 245,985 | 270,591 | 286,485 | 273,663 | 238,205 | 271,677 |
| 2000's | 276,919 | 280,039 | 262,192 | 258,702 | 254,433 | 279,065 | 241,900 | 263,053 | 268,635 | 228,949 |
| 2010's | 266,751 | 247,835 | 232,641 | 258,689 | 311,475 | 245,743 | 246,845 | 239,567 | 283,045 | 286,996 |
| 2020's | 267,699 | 259,247 | 292,078 | 276,411 | 276,430 |
| - = No Data Reported; -- = Not Applicable; NA = Not Available; W = Withheld to avoid disclosure of individual company data. |
| Release Date: 6/30/2026 |
| Next Release Date: 7/31/2026 |