|
Download Data (XLS File) |
|
|||||
|
|||||
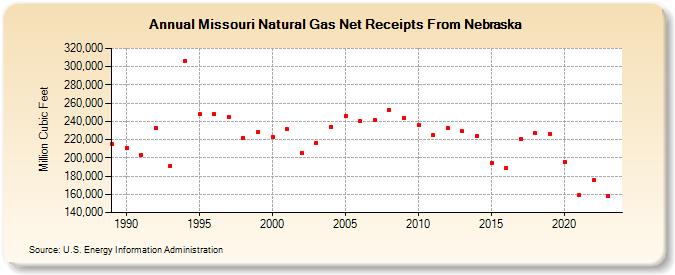
| Missouri Natural Gas Net Receipts From Nebraska (Million Cubic Feet) | |||||
| Decade | Year-0 | Year-1 | Year-2 | Year-3 | Year-4 | Year-5 | Year-6 | Year-7 | Year-8 | Year-9 |
|---|---|---|---|---|---|---|---|---|---|---|
| 1980's | 214,630 | |||||||||
| 1990's | 210,972 | 203,344 | 232,880 | 191,200 | 306,686 | 247,769 | 248,550 | 244,329 | 221,512 | 228,059 |
| 2000's | 223,085 | 231,431 | 205,472 | 216,487 | 234,189 | 245,673 | 240,207 | 241,132 | 252,509 | 243,533 |
| 2010's | 236,249 | 224,569 | 232,684 | 228,917 | 223,826 | 194,354 | 189,154 | 220,878 | 226,779 | 226,453 |
| 2020's | 195,895 | 159,313 | 175,371 | 158,693 | 166,576 |
| - = No Data Reported; -- = Not Applicable; NA = Not Available; W = Withheld to avoid disclosure of individual company data. |
| Release Date: 6/30/2026 |
| Next Release Date: 7/31/2026 |