|
Download Data (XLS File) |
|
|||||
|
|||||
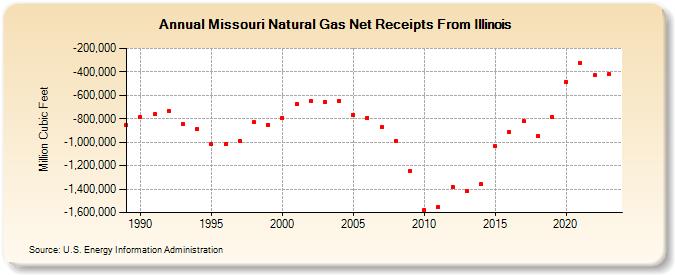
| Missouri Natural Gas Net Receipts From Illinois (Million Cubic Feet) | |||||
| Decade | Year-0 | Year-1 | Year-2 | Year-3 | Year-4 | Year-5 | Year-6 | Year-7 | Year-8 | Year-9 |
|---|---|---|---|---|---|---|---|---|---|---|
| 1980's | -855,181 | |||||||||
| 1990's | -786,634 | -762,899 | -730,744 | -845,081 | -886,398 | -1,016,356 | -1,015,520 | -987,980 | -831,469 | -850,653 |
| 2000's | -791,060 | -675,443 | -651,322 | -657,181 | -645,900 | -766,350 | -793,200 | -868,701 | -988,569 | -1,242,031 |
| 2010's | -1,576,277 | -1,554,539 | -1,377,904 | -1,412,493 | -1,358,734 | -1,034,274 | -910,563 | -819,393 | -944,840 | -786,712 |
| 2020's | -483,440 | -322,215 | -430,810 | -422,363 | -432,865 |
| - = No Data Reported; -- = Not Applicable; NA = Not Available; W = Withheld to avoid disclosure of individual company data. |
| Release Date: 6/30/2026 |
| Next Release Date: 7/31/2026 |