|
Download Data (XLS File) |
|
|||||
|
|||||
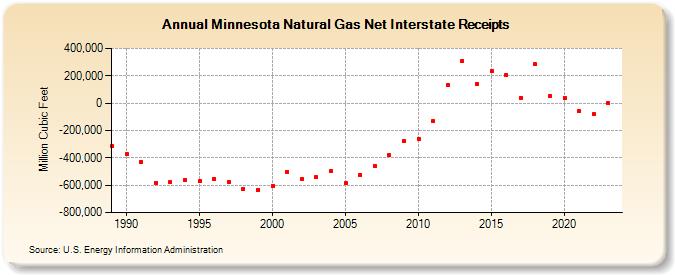
| Minnesota Natural Gas Net Interstate Receipts (Million Cubic Feet) | |||||
| Decade | Year-0 | Year-1 | Year-2 | Year-3 | Year-4 | Year-5 | Year-6 | Year-7 | Year-8 | Year-9 |
|---|---|---|---|---|---|---|---|---|---|---|
| 1980's | -313,513 | |||||||||
| 1990's | -373,575 | -426,832 | -581,763 | -579,033 | -563,335 | -570,828 | -551,116 | -579,348 | -626,113 | -632,977 |
| 2000's | -604,669 | -499,900 | -552,416 | -542,149 | -494,370 | -587,023 | -525,412 | -459,373 | -380,843 | -277,574 |
| 2010's | -258,740 | -131,158 | 132,935 | 306,579 | 140,198 | 235,859 | 208,909 | 40,932 | 282,572 | 53,425 |
| 2020's | 40,957 | -61,094 | -79,166 | -1,067 | -120,713 |
| - = No Data Reported; -- = Not Applicable; NA = Not Available; W = Withheld to avoid disclosure of individual company data. |
| Release Date: 6/30/2026 |
| Next Release Date: 7/31/2026 |