|
Download Data (XLS File) |
|
|||||
|
|||||
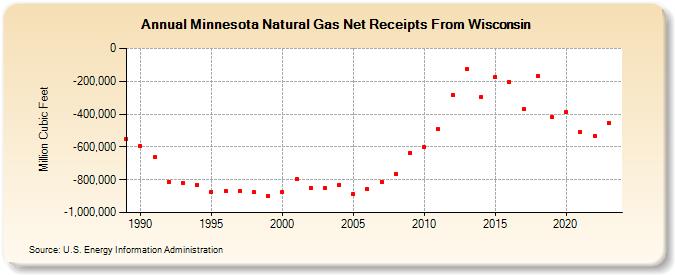
| Minnesota Natural Gas Net Receipts From Wisconsin (Million Cubic Feet) | |||||
| Decade | Year-0 | Year-1 | Year-2 | Year-3 | Year-4 | Year-5 | Year-6 | Year-7 | Year-8 | Year-9 |
|---|---|---|---|---|---|---|---|---|---|---|
| 1980's | -553,205 | |||||||||
| 1990's | -594,562 | -664,607 | -812,678 | -817,672 | -832,011 | -871,842 | -869,951 | -870,995 | -875,686 | -896,187 |
| 2000's | -877,598 | -795,903 | -847,779 | -849,396 | -829,650 | -886,611 | -856,530 | -811,007 | -763,634 | -634,331 |
| 2010's | -603,228 | -491,891 | -282,260 | -126,802 | -295,317 | -173,908 | -202,156 | -370,382 | -165,240 | -418,520 |
| 2020's | -388,884 | -510,351 | -530,755 | -452,846 | -563,367 |
| - = No Data Reported; -- = Not Applicable; NA = Not Available; W = Withheld to avoid disclosure of individual company data. |
| Release Date: 6/30/2026 |
| Next Release Date: 7/31/2026 |