|
Download Data (XLS File) |
|
|||||
|
|||||
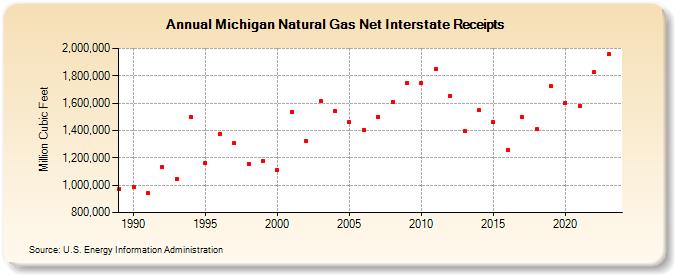
| Michigan Natural Gas Net Interstate Receipts (Million Cubic Feet) | |||||
| Decade | Year-0 | Year-1 | Year-2 | Year-3 | Year-4 | Year-5 | Year-6 | Year-7 | Year-8 | Year-9 |
|---|---|---|---|---|---|---|---|---|---|---|
| 1980's | 971,496 | |||||||||
| 1990's | 990,176 | 939,653 | 1,129,512 | 1,042,347 | 1,495,917 | 1,159,156 | 1,376,700 | 1,306,300 | 1,155,676 | 1,177,341 |
| 2000's | 1,112,200 | 1,537,520 | 1,324,290 | 1,616,387 | 1,543,350 | 1,458,353 | 1,405,612 | 1,501,861 | 1,608,421 | 1,745,362 |
| 2010's | 1,745,655 | 1,850,005 | 1,654,176 | 1,392,978 | 1,546,162 | 1,461,242 | 1,255,930 | 1,500,102 | 1,408,174 | 1,724,834 |
| 2020's | 1,603,858 | 1,580,817 | 1,824,382 | 1,956,315 | 1,862,045 |
| - = No Data Reported; -- = Not Applicable; NA = Not Available; W = Withheld to avoid disclosure of individual company data. |
| Release Date: 6/30/2026 |
| Next Release Date: 7/31/2026 |