|
Download Data (XLS File) |
|
|||||
|
|||||
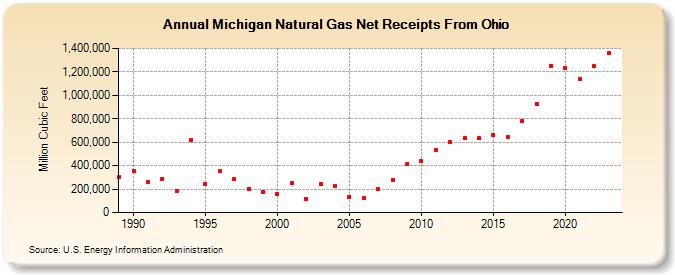
| Michigan Natural Gas Net Receipts From Ohio (Million Cubic Feet) | |||||
| Decade | Year-0 | Year-1 | Year-2 | Year-3 | Year-4 | Year-5 | Year-6 | Year-7 | Year-8 | Year-9 |
|---|---|---|---|---|---|---|---|---|---|---|
| 1980's | 303,439 | |||||||||
| 1990's | 356,575 | 257,796 | 288,724 | 181,530 | 622,233 | 245,134 | 350,747 | 284,975 | 198,704 | 177,849 |
| 2000's | 156,085 | 249,662 | 119,605 | 239,410 | 229,079 | 135,541 | 125,585 | 202,029 | 281,567 | 417,355 |
| 2010's | 435,695 | 531,611 | 601,361 | 635,097 | 632,904 | 660,905 | 645,767 | 776,809 | 929,435 | 1,250,302 |
| 2020's | 1,229,844 | 1,139,628 | 1,249,627 | 1,358,309 | 1,192,773 |
| - = No Data Reported; -- = Not Applicable; NA = Not Available; W = Withheld to avoid disclosure of individual company data. |
| Release Date: 6/30/2026 |
| Next Release Date: 7/31/2026 |