|
Download Data (XLS File) |
|
|||||
|
|||||
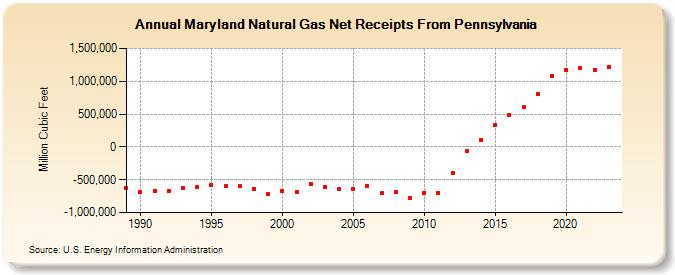
| Maryland Natural Gas Net Receipts From Pennsylvania (Million Cubic Feet) | |||||
| Decade | Year-0 | Year-1 | Year-2 | Year-3 | Year-4 | Year-5 | Year-6 | Year-7 | Year-8 | Year-9 |
|---|---|---|---|---|---|---|---|---|---|---|
| 1980's | -623,683 | |||||||||
| 1990's | -689,884 | -676,569 | -672,985 | -631,454 | -608,834 | -573,576 | -596,318 | -589,342 | -635,078 | -722,547 |
| 2000's | -677,201 | -686,449 | -564,936 | -611,836 | -642,405 | -638,350 | -588,683 | -700,160 | -690,713 | -776,790 |
| 2010's | -695,143 | -696,327 | -393,272 | -55,804 | 108,747 | 340,507 | 483,603 | 613,903 | 807,556 | 1,078,997 |
| 2020's | 1,174,412 | 1,207,170 | 1,176,845 | 1,223,154 | 1,101,452 |
| - = No Data Reported; -- = Not Applicable; NA = Not Available; W = Withheld to avoid disclosure of individual company data. |
| Release Date: 6/30/2026 |
| Next Release Date: 7/31/2026 |