|
Download Data (XLS File) |
|
|||||
|
|||||
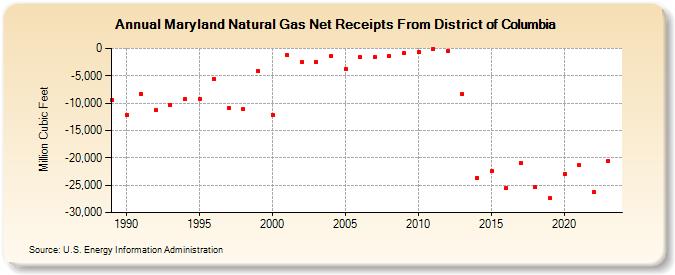
| Maryland Natural Gas Net Receipts From District of Columbia (Million Cubic Feet) | |||||
| Decade | Year-0 | Year-1 | Year-2 | Year-3 | Year-4 | Year-5 | Year-6 | Year-7 | Year-8 | Year-9 |
|---|---|---|---|---|---|---|---|---|---|---|
| 1980's | -9,476 | |||||||||
| 1990's | -12,147 | -8,320 | -11,346 | -10,367 | -9,225 | -9,203 | -5,600 | -10,879 | -11,135 | -4,097 |
| 2000's | -12,095 | -1,264 | -2,452 | -2,446 | -1,448 | -3,726 | -1,591 | -1,590 | -1,459 | -902 |
| 2010's | -701 | -39 | -469 | -8,319 | -23,660 | -22,464 | -25,538 | -20,912 | -25,388 | -27,410 |
| 2020's | -22,993 | -21,366 | -26,239 | -20,546 | -19,135 |
| - = No Data Reported; -- = Not Applicable; NA = Not Available; W = Withheld to avoid disclosure of individual company data. |
| Release Date: 6/30/2026 |
| Next Release Date: 7/31/2026 |