|
Download Data (XLS File) |
|
|||||
|
|||||
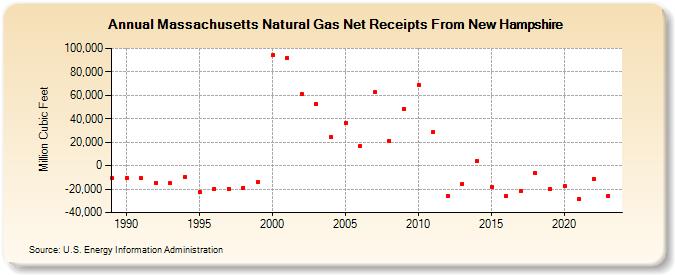
| Massachusetts Natural Gas Net Receipts From New Hampshire (Million Cubic Feet) | |||||
| Decade | Year-0 | Year-1 | Year-2 | Year-3 | Year-4 | Year-5 | Year-6 | Year-7 | Year-8 | Year-9 |
|---|---|---|---|---|---|---|---|---|---|---|
| 1980's | -10,864 | |||||||||
| 1990's | -10,203 | -10,844 | -14,457 | -15,135 | -9,460 | -22,407 | -19,498 | -19,585 | -18,774 | -13,824 |
| 2000's | 93,941 | 91,877 | 61,100 | 52,749 | 24,418 | 36,454 | 16,822 | 62,574 | 21,009 | 48,639 |
| 2010's | 68,889 | 28,304 | -26,010 | -15,394 | 4,176 | -18,154 | -26,057 | -21,317 | -6,400 | -19,860 |
| 2020's | -17,761 | -28,260 | -11,032 | -25,704 | -7,547 |
| - = No Data Reported; -- = Not Applicable; NA = Not Available; W = Withheld to avoid disclosure of individual company data. |
| Release Date: 6/30/2026 |
| Next Release Date: 7/31/2026 |