|
Download Data (XLS File) |
|
|||||
|
|||||
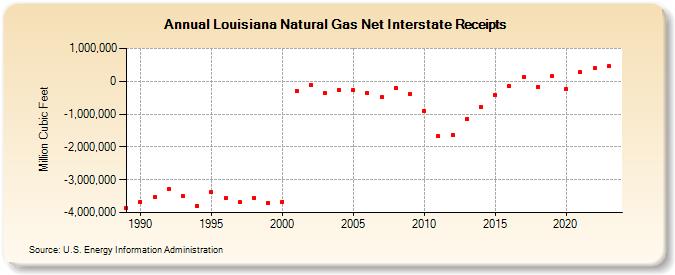
| Louisiana Natural Gas Net Interstate Receipts (Million Cubic Feet) | |||||
| Decade | Year-0 | Year-1 | Year-2 | Year-3 | Year-4 | Year-5 | Year-6 | Year-7 | Year-8 | Year-9 |
|---|---|---|---|---|---|---|---|---|---|---|
| 1980's | -3,849,793 | |||||||||
| 1990's | -3,670,463 | -3,526,880 | -3,295,694 | -3,504,796 | -3,804,900 | -3,388,579 | -3,549,945 | -3,681,223 | -3,542,665 | -3,699,296 |
| 2000's | -3,663,489 | -297,766 | -112,117 | -363,673 | -253,190 | -271,407 | -362,916 | -493,244 | -203,350 | -380,131 |
| 2010's | -907,312 | -1,672,026 | -1,625,708 | -1,143,242 | -775,714 | -417,515 | -146,388 | 130,627 | -165,102 | 150,834 |
| 2020's | -239,688 | 268,685 | 389,925 | 450,507 | 1,055,314 |
| - = No Data Reported; -- = Not Applicable; NA = Not Available; W = Withheld to avoid disclosure of individual company data. |
| Release Date: 6/30/2026 |
| Next Release Date: 7/31/2026 |