|
Download Data (XLS File) |
|
|||||
|
|||||
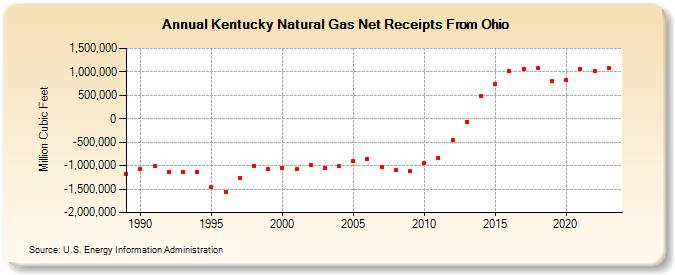
| Kentucky Natural Gas Net Receipts From Ohio (Million Cubic Feet) | |||||
| Decade | Year-0 | Year-1 | Year-2 | Year-3 | Year-4 | Year-5 | Year-6 | Year-7 | Year-8 | Year-9 |
|---|---|---|---|---|---|---|---|---|---|---|
| 1980's | -1,184,511 | |||||||||
| 1990's | -1,070,260 | -1,003,445 | -1,134,226 | -1,142,882 | -1,131,765 | -1,462,777 | -1,552,181 | -1,261,667 | -1,001,373 | -1,067,208 |
| 2000's | -1,049,979 | -1,076,953 | -996,090 | -1,043,540 | -1,013,147 | -909,100 | -857,868 | -1,034,411 | -1,087,773 | -1,114,787 |
| 2010's | -945,045 | -837,297 | -463,049 | -73,488 | 495,200 | 749,938 | 1,020,240 | 1,055,465 | 1,075,333 | 810,459 |
| 2020's | 834,531 | 1,062,190 | 1,023,626 | 1,077,545 | 1,050,146 |
| - = No Data Reported; -- = Not Applicable; NA = Not Available; W = Withheld to avoid disclosure of individual company data. |
| Release Date: 6/30/2026 |
| Next Release Date: 7/31/2026 |