|
Download Data (XLS File) |
|
|||||
|
|||||
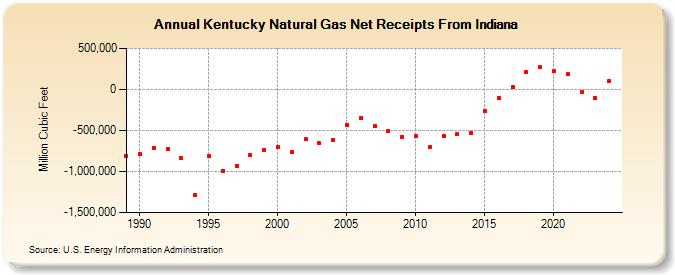
| Kentucky Natural Gas Net Receipts From Indiana (Million Cubic Feet) | |||||
| Decade | Year-0 | Year-1 | Year-2 | Year-3 | Year-4 | Year-5 | Year-6 | Year-7 | Year-8 | Year-9 |
|---|---|---|---|---|---|---|---|---|---|---|
| 1980's | -804,947 | |||||||||
| 1990's | -787,969 | -718,886 | -726,236 | -832,826 | -1,284,033 | -814,412 | -988,335 | -927,090 | -793,968 | -734,463 |
| 2000's | -700,525 | -760,942 | -607,381 | -658,285 | -611,849 | -429,091 | -348,214 | -450,864 | -508,809 | -574,696 |
| 2010's | -567,842 | -697,349 | -567,829 | -547,428 | -528,564 | -266,475 | -103,632 | 28,600 | 208,475 | 269,233 |
| 2020's | 220,631 | 187,409 | -32,812 | -99,350 | 101,753 |
| - = No Data Reported; -- = Not Applicable; NA = Not Available; W = Withheld to avoid disclosure of individual company data. |
| Release Date: 6/30/2026 |
| Next Release Date: 7/31/2026 |