|
Download Data (XLS File) |
|
|||||
|
|||||
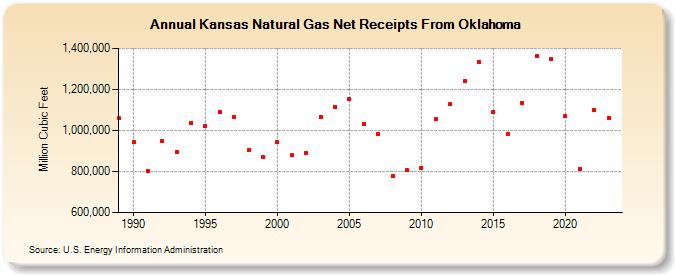
| Kansas Natural Gas Net Receipts From Oklahoma (Million Cubic Feet) | |||||
| Decade | Year-0 | Year-1 | Year-2 | Year-3 | Year-4 | Year-5 | Year-6 | Year-7 | Year-8 | Year-9 |
|---|---|---|---|---|---|---|---|---|---|---|
| 1980's | 1,058,399 | |||||||||
| 1990's | 942,303 | 802,706 | 947,961 | 894,343 | 1,034,976 | 1,024,131 | 1,089,013 | 1,065,765 | 905,088 | 869,180 |
| 2000's | 942,313 | 878,367 | 890,870 | 1,068,054 | 1,116,220 | 1,150,955 | 1,029,239 | 981,220 | 778,068 | 806,958 |
| 2010's | 818,507 | 1,053,629 | 1,127,149 | 1,241,144 | 1,333,582 | 1,091,937 | 984,885 | 1,132,940 | 1,361,688 | 1,350,563 |
| 2020's | 1,070,469 | 811,654 | 1,098,848 | 1,061,866 | 1,008,893 |
| - = No Data Reported; -- = Not Applicable; NA = Not Available; W = Withheld to avoid disclosure of individual company data. |
| Release Date: 6/30/2026 |
| Next Release Date: 7/31/2026 |