|
Download Data (XLS File) |
|
|||||
|
|||||
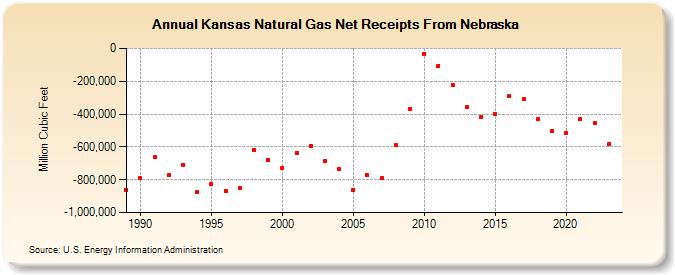
| Kansas Natural Gas Net Receipts From Nebraska (Million Cubic Feet) | |||||
| Decade | Year-0 | Year-1 | Year-2 | Year-3 | Year-4 | Year-5 | Year-6 | Year-7 | Year-8 | Year-9 |
|---|---|---|---|---|---|---|---|---|---|---|
| 1980's | -860,739 | |||||||||
| 1990's | -791,782 | -661,613 | -771,793 | -710,322 | -877,072 | -829,047 | -869,504 | -852,017 | -618,147 | -680,171 |
| 2000's | -726,455 | -635,088 | -592,970 | -684,912 | -735,546 | -859,591 | -773,726 | -786,460 | -587,179 | -369,838 |
| 2010's | -32,182 | -104,789 | -219,973 | -358,404 | -420,789 | -397,603 | -290,115 | -307,047 | -430,576 | -505,692 |
| 2020's | -516,320 | -430,861 | -457,468 | -585,020 | -495,932 |
| - = No Data Reported; -- = Not Applicable; NA = Not Available; W = Withheld to avoid disclosure of individual company data. |
| Release Date: 6/30/2026 |
| Next Release Date: 7/31/2026 |