|
Download Data (XLS File) |
|
|||||
|
|||||
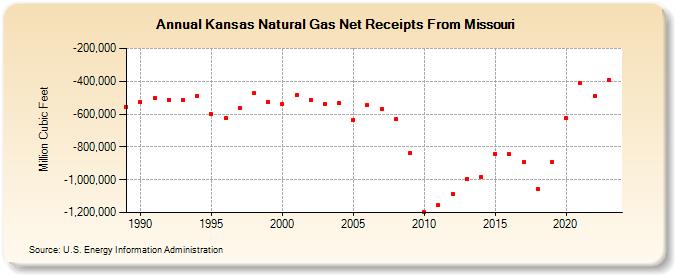
| Kansas Natural Gas Net Receipts From Missouri (Million Cubic Feet) | |||||
| Decade | Year-0 | Year-1 | Year-2 | Year-3 | Year-4 | Year-5 | Year-6 | Year-7 | Year-8 | Year-9 |
|---|---|---|---|---|---|---|---|---|---|---|
| 1980's | -555,359 | |||||||||
| 1990's | -526,174 | -503,623 | -511,396 | -515,353 | -487,586 | -600,048 | -625,779 | -565,965 | -474,343 | -523,796 |
| 2000's | -540,836 | -484,093 | -513,968 | -540,568 | -535,515 | -637,229 | -545,915 | -570,468 | -633,036 | -838,446 |
| 2010's | -1,198,355 | -1,156,270 | -1,086,140 | -992,900 | -982,687 | -840,490 | -845,594 | -893,542 | -1,057,601 | -889,850 |
| 2020's | -625,065 | -412,645 | -492,278 | -393,760 | -517,487 |
| - = No Data Reported; -- = Not Applicable; NA = Not Available; W = Withheld to avoid disclosure of individual company data. |
| Release Date: 6/30/2026 |
| Next Release Date: 7/31/2026 |