|
Download Data (XLS File) |
|
|||||
|
|||||
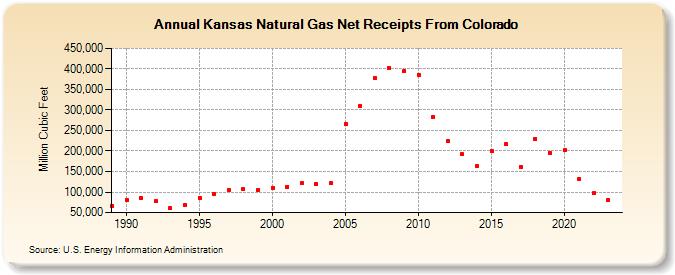
| Kansas Natural Gas Net Receipts From Colorado (Million Cubic Feet) | |||||
| Decade | Year-0 | Year-1 | Year-2 | Year-3 | Year-4 | Year-5 | Year-6 | Year-7 | Year-8 | Year-9 |
|---|---|---|---|---|---|---|---|---|---|---|
| 1980's | 67,173 | |||||||||
| 1990's | 81,447 | 86,152 | 77,560 | 60,227 | 67,430 | 86,265 | 95,358 | 103,952 | 106,521 | 105,402 |
| 2000's | 110,787 | 113,314 | 121,759 | 119,991 | 120,953 | 266,360 | 310,686 | 378,035 | 402,253 | 394,168 |
| 2010's | 386,007 | 282,483 | 223,168 | 191,689 | 162,679 | 200,604 | 216,722 | 161,640 | 229,806 | 195,698 |
| 2020's | 201,715 | 132,765 | 97,382 | 80,296 | 170,410 |
| - = No Data Reported; -- = Not Applicable; NA = Not Available; W = Withheld to avoid disclosure of individual company data. |
| Release Date: 6/30/2026 |
| Next Release Date: 7/31/2026 |