|
Download Data (XLS File) |
|
|||||
|
|||||
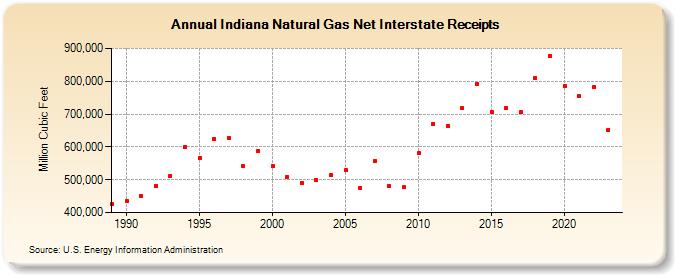
| Indiana Natural Gas Net Interstate Receipts (Million Cubic Feet) | |||||
| Decade | Year-0 | Year-1 | Year-2 | Year-3 | Year-4 | Year-5 | Year-6 | Year-7 | Year-8 | Year-9 |
|---|---|---|---|---|---|---|---|---|---|---|
| 1980's | 425,159 | |||||||||
| 1990's | 436,420 | 449,198 | 480,369 | 512,110 | 600,860 | 565,456 | 624,743 | 627,176 | 540,755 | 587,213 |
| 2000's | 541,557 | 509,215 | 489,468 | 499,638 | 512,995 | 528,319 | 475,765 | 558,144 | 481,051 | 476,890 |
| 2010's | 579,923 | 669,748 | 663,654 | 717,624 | 791,732 | 706,992 | 718,682 | 705,668 | 810,985 | 877,740 |
| 2020's | 786,951 | 754,068 | 782,356 | 652,858 | 675,565 |
| - = No Data Reported; -- = Not Applicable; NA = Not Available; W = Withheld to avoid disclosure of individual company data. |
| Release Date: 6/30/2026 |
| Next Release Date: 7/31/2026 |