|
Download Data (XLS File) |
|
|||||
|
|||||
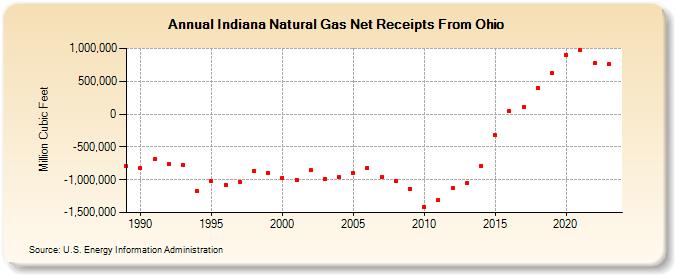
| Indiana Natural Gas Net Receipts From Ohio (Million Cubic Feet) | |||||
| Decade | Year-0 | Year-1 | Year-2 | Year-3 | Year-4 | Year-5 | Year-6 | Year-7 | Year-8 | Year-9 |
|---|---|---|---|---|---|---|---|---|---|---|
| 1980's | -795,306 | |||||||||
| 1990's | -818,782 | -690,790 | -766,768 | -780,437 | -1,174,319 | -1,020,317 | -1,078,341 | -1,031,439 | -860,668 | -891,868 |
| 2000's | -968,414 | -996,901 | -857,200 | -984,559 | -965,762 | -899,932 | -817,137 | -953,553 | -1,022,793 | -1,134,287 |
| 2010's | -1,417,956 | -1,308,613 | -1,128,381 | -1,056,263 | -790,363 | -324,723 | 40,040 | 112,259 | 397,536 | 626,216 |
| 2020's | 901,955 | 973,181 | 772,033 | 757,058 | 795,741 |
| - = No Data Reported; -- = Not Applicable; NA = Not Available; W = Withheld to avoid disclosure of individual company data. |
| Release Date: 6/30/2026 |
| Next Release Date: 7/31/2026 |