|
Download Data (XLS File) |
|
|||||
|
|||||
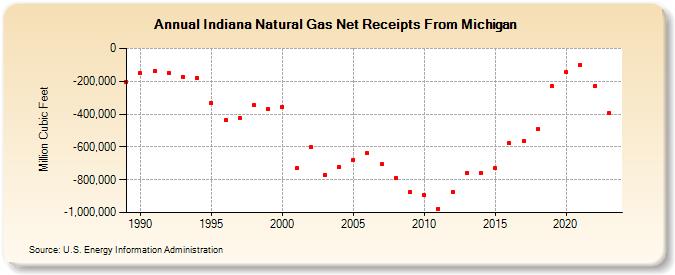
| Indiana Natural Gas Net Receipts From Michigan (Million Cubic Feet) | |||||
| Decade | Year-0 | Year-1 | Year-2 | Year-3 | Year-4 | Year-5 | Year-6 | Year-7 | Year-8 | Year-9 |
|---|---|---|---|---|---|---|---|---|---|---|
| 1980's | -203,932 | |||||||||
| 1990's | -151,752 | -139,016 | -148,079 | -174,000 | -177,698 | -332,758 | -435,460 | -423,414 | -346,706 | -369,941 |
| 2000's | -355,082 | -731,158 | -603,124 | -771,254 | -722,440 | -678,716 | -639,565 | -706,363 | -789,652 | -874,399 |
| 2010's | -894,743 | -975,970 | -872,308 | -756,927 | -759,386 | -729,352 | -577,972 | -566,294 | -491,877 | -230,002 |
| 2020's | -145,654 | -98,701 | -231,170 | -394,232 | -306,611 |
| - = No Data Reported; -- = Not Applicable; NA = Not Available; W = Withheld to avoid disclosure of individual company data. |
| Release Date: 6/30/2026 |
| Next Release Date: 7/31/2026 |