|
Download Data (XLS File) |
|
|||||
|
|||||
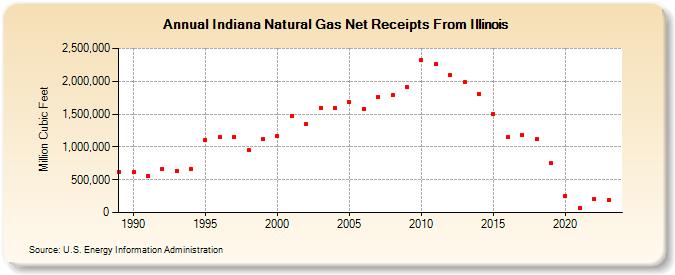
| Indiana Natural Gas Net Receipts From Illinois (Million Cubic Feet) | |||||
| Decade | Year-0 | Year-1 | Year-2 | Year-3 | Year-4 | Year-5 | Year-6 | Year-7 | Year-8 | Year-9 |
|---|---|---|---|---|---|---|---|---|---|---|
| 1980's | 619,451 | |||||||||
| 1990's | 618,984 | 560,118 | 668,980 | 633,721 | 668,844 | 1,104,118 | 1,150,210 | 1,154,940 | 954,160 | 1,114,558 |
| 2000's | 1,164,528 | 1,476,332 | 1,342,412 | 1,597,166 | 1,589,347 | 1,677,876 | 1,584,253 | 1,767,196 | 1,784,687 | 1,910,880 |
| 2010's | 2,324,780 | 2,256,983 | 2,096,514 | 1,983,386 | 1,813,034 | 1,494,752 | 1,153,102 | 1,188,303 | 1,113,805 | 750,759 |
| 2020's | 251,281 | 66,996 | 208,681 | 190,682 | 288,188 |
| - = No Data Reported; -- = Not Applicable; NA = Not Available; W = Withheld to avoid disclosure of individual company data. |
| Release Date: 6/30/2026 |
| Next Release Date: 7/31/2026 |