|
Download Data (XLS File) |
|
|||||
|
|||||
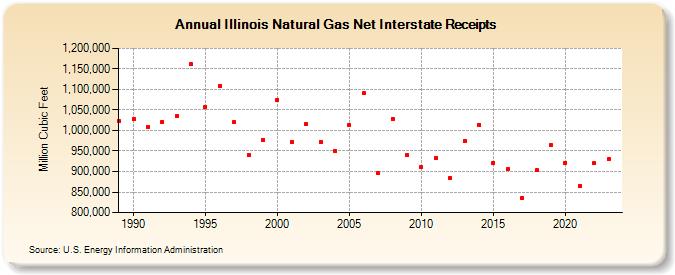
| Illinois Natural Gas Net Interstate Receipts (Million Cubic Feet) | |||||
| Decade | Year-0 | Year-1 | Year-2 | Year-3 | Year-4 | Year-5 | Year-6 | Year-7 | Year-8 | Year-9 |
|---|---|---|---|---|---|---|---|---|---|---|
| 1980's | 1,022,488 | |||||||||
| 1990's | 1,027,573 | 1,009,311 | 1,021,441 | 1,034,929 | 1,161,327 | 1,057,902 | 1,108,583 | 1,020,287 | 940,495 | 977,570 |
| 2000's | 1,073,753 | 971,822 | 1,015,624 | 972,565 | 950,493 | 1,012,744 | 1,090,595 | 896,446 | 1,028,715 | 939,661 |
| 2010's | 910,216 | 932,327 | 884,932 | 974,389 | 1,013,953 | 920,663 | 906,623 | 835,808 | 902,523 | 964,656 |
| 2020's | 921,964 | 865,850 | 919,616 | 930,446 | 890,658 |
| - = No Data Reported; -- = Not Applicable; NA = Not Available; W = Withheld to avoid disclosure of individual company data. |
| Release Date: 6/30/2026 |
| Next Release Date: 7/31/2026 |