|
Download Data (XLS File) |
|
|||||
|
|||||
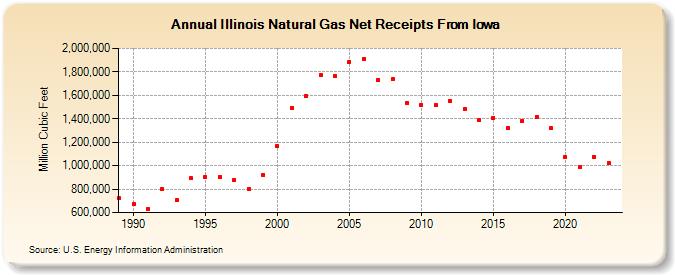
| Illinois Natural Gas Net Receipts From Iowa (Million Cubic Feet) | |||||
| Decade | Year-0 | Year-1 | Year-2 | Year-3 | Year-4 | Year-5 | Year-6 | Year-7 | Year-8 | Year-9 |
|---|---|---|---|---|---|---|---|---|---|---|
| 1980's | 720,307 | |||||||||
| 1990's | 674,425 | 632,273 | 800,999 | 705,364 | 891,014 | 903,154 | 907,398 | 877,183 | 804,044 | 923,216 |
| 2000's | 1,167,241 | 1,492,818 | 1,594,098 | 1,769,009 | 1,762,639 | 1,886,778 | 1,911,730 | 1,734,230 | 1,738,096 | 1,535,050 |
| 2010's | 1,519,524 | 1,515,239 | 1,551,735 | 1,480,844 | 1,385,357 | 1,406,506 | 1,321,115 | 1,384,566 | 1,416,919 | 1,319,119 |
| 2020's | 1,072,919 | 987,120 | 1,076,035 | 1,021,922 | 1,140,969 |
| - = No Data Reported; -- = Not Applicable; NA = Not Available; W = Withheld to avoid disclosure of individual company data. |
| Release Date: 6/30/2026 |
| Next Release Date: 7/31/2026 |