|
Download Data (XLS File) |
|
|||||
|
|||||
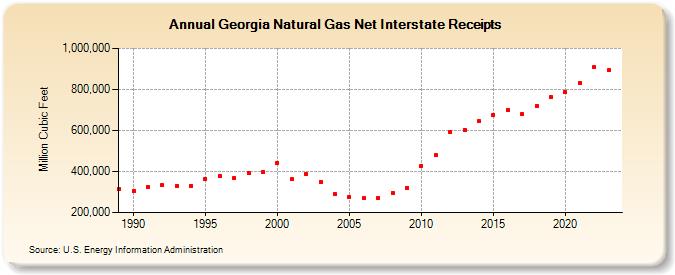
| Georgia Natural Gas Net Interstate Receipts (Million Cubic Feet) | |||||
| Decade | Year-0 | Year-1 | Year-2 | Year-3 | Year-4 | Year-5 | Year-6 | Year-7 | Year-8 | Year-9 |
|---|---|---|---|---|---|---|---|---|---|---|
| 1980's | 313,535 | |||||||||
| 1990's | 304,127 | 326,237 | 332,967 | 329,591 | 331,812 | 364,073 | 378,006 | 369,230 | 394,824 | 397,865 |
| 2000's | 442,386 | 362,308 | 387,873 | 350,912 | 289,530 | 276,263 | 269,325 | 272,017 | 296,594 | 320,932 |
| 2010's | 428,427 | 478,546 | 593,689 | 603,882 | 643,983 | 676,500 | 698,731 | 681,014 | 719,644 | 761,120 |
| 2020's | 786,748 | 833,472 | 907,239 | 892,550 | 881,031 |
| - = No Data Reported; -- = Not Applicable; NA = Not Available; W = Withheld to avoid disclosure of individual company data. |
| Release Date: 6/30/2026 |
| Next Release Date: 7/31/2026 |