|
Download Data (XLS File) |
|
|||||
|
|||||
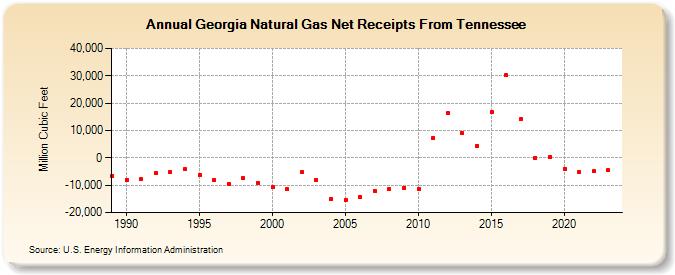
| Georgia Natural Gas Net Receipts From Tennessee (Million Cubic Feet) | |||||
| Decade | Year-0 | Year-1 | Year-2 | Year-3 | Year-4 | Year-5 | Year-6 | Year-7 | Year-8 | Year-9 |
|---|---|---|---|---|---|---|---|---|---|---|
| 1980's | -6,650 | |||||||||
| 1990's | -8,079 | -7,904 | -5,599 | -5,355 | -4,257 | -6,182 | -8,129 | -9,406 | -7,500 | -9,179 |
| 2000's | -10,762 | -11,420 | -5,307 | -7,949 | -14,947 | -15,428 | -14,360 | -12,069 | -11,397 | -10,918 |
| 2010's | -11,356 | 7,306 | 16,208 | 8,930 | 4,340 | 16,715 | 30,125 | 14,041 | -3 | 358 |
| 2020's | -3,945 | -5,304 | -4,950 | -4,558 | -4,910 |
| - = No Data Reported; -- = Not Applicable; NA = Not Available; W = Withheld to avoid disclosure of individual company data. |
| Release Date: 6/30/2026 |
| Next Release Date: 7/31/2026 |