|
Download Data (XLS File) |
|
|||||
|
|||||
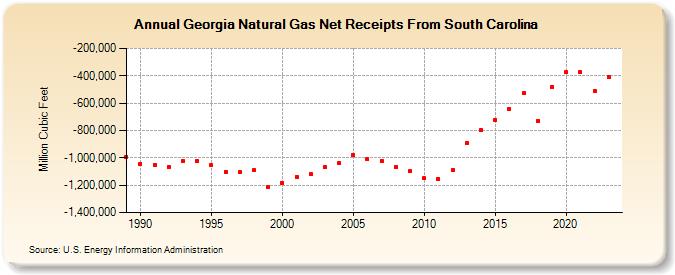
| Georgia Natural Gas Net Receipts From South Carolina (Million Cubic Feet) | |||||
| Decade | Year-0 | Year-1 | Year-2 | Year-3 | Year-4 | Year-5 | Year-6 | Year-7 | Year-8 | Year-9 |
|---|---|---|---|---|---|---|---|---|---|---|
| 1980's | -991,554 | |||||||||
| 1990's | -1,042,084 | -1,050,477 | -1,065,949 | -1,024,125 | -1,025,745 | -1,053,346 | -1,102,769 | -1,105,837 | -1,091,913 | -1,210,330 |
| 2000's | -1,184,473 | -1,138,120 | -1,118,507 | -1,069,638 | -1,036,040 | -979,459 | -1,006,857 | -1,021,428 | -1,065,712 | -1,098,304 |
| 2010's | -1,149,855 | -1,153,358 | -1,088,659 | -892,618 | -794,997 | -720,848 | -640,960 | -526,427 | -727,620 | -480,572 |
| 2020's | -375,275 | -375,040 | -508,909 | -405,984 | -422,503 |
| - = No Data Reported; -- = Not Applicable; NA = Not Available; W = Withheld to avoid disclosure of individual company data. |
| Release Date: 6/30/2026 |
| Next Release Date: 7/31/2026 |