|
Download Data (XLS File) |
|
|||||
|
|||||
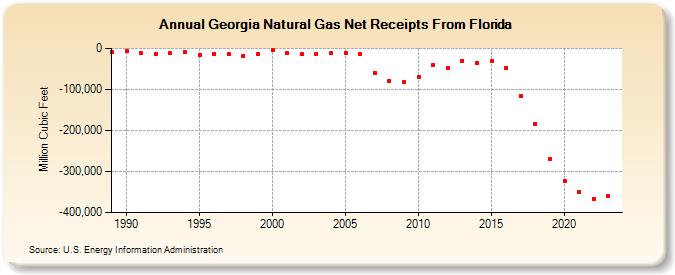
| Georgia Natural Gas Net Receipts From Florida (Million Cubic Feet) | |||||
| Decade | Year-0 | Year-1 | Year-2 | Year-3 | Year-4 | Year-5 | Year-6 | Year-7 | Year-8 | Year-9 |
|---|---|---|---|---|---|---|---|---|---|---|
| 1980's | -8,870 | |||||||||
| 1990's | -7,125 | -12,432 | -13,798 | -12,371 | -9,837 | -16,306 | -14,064 | -14,407 | -17,434 | -13,955 |
| 2000's | -3,141 | -12,021 | -13,890 | -12,815 | -11,707 | -11,307 | -13,834 | -60,502 | -79,285 | -82,416 |
| 2010's | -70,431 | -41,133 | -48,076 | -29,647 | -35,374 | -31,205 | -48,795 | -115,217 | -184,003 | -268,296 |
| 2020's | -322,378 | -349,205 | -366,176 | -360,356 | -375,007 |
| - = No Data Reported; -- = Not Applicable; NA = Not Available; W = Withheld to avoid disclosure of individual company data. |
| Release Date: 6/30/2026 |
| Next Release Date: 7/31/2026 |