|
Download Data (XLS File) |
|
|||||
|
|||||
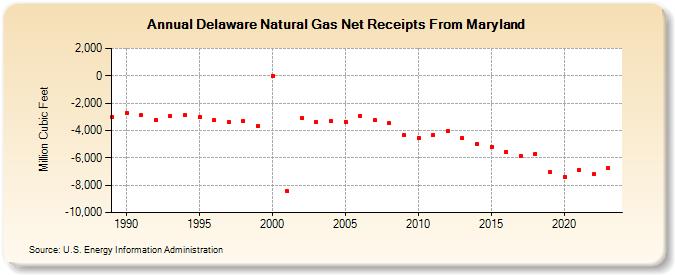
| Delaware Natural Gas Net Receipts From Maryland (Million Cubic Feet) | |||||
| Decade | Year-0 | Year-1 | Year-2 | Year-3 | Year-4 | Year-5 | Year-6 | Year-7 | Year-8 | Year-9 |
|---|---|---|---|---|---|---|---|---|---|---|
| 1980's | -3,005 | |||||||||
| 1990's | -2,730 | -2,894 | -3,230 | -2,963 | -2,896 | -3,030 | -3,252 | -3,405 | -3,308 | -3,666 |
| 2000's | 0 | -8,444 | -3,058 | -3,393 | -3,336 | -3,349 | -2,940 | -3,258 | -3,479 | -4,365 |
| 2010's | -4,534 | -4,345 | -4,052 | -4,560 | -4,975 | -5,205 | -5,538 | -5,863 | -5,693 | -7,067 |
| 2020's | -7,384 | -6,871 | -7,216 | -6,779 | -6,950 |
| - = No Data Reported; -- = Not Applicable; NA = Not Available; W = Withheld to avoid disclosure of individual company data. |
| Release Date: 6/30/2026 |
| Next Release Date: 7/31/2026 |