|
Download Data (XLS File) |
|
|||||
|
|||||
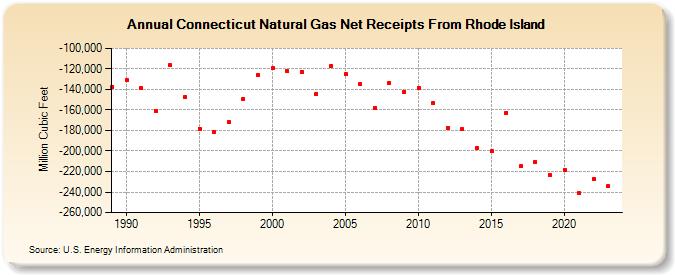
| Connecticut Natural Gas Net Receipts From Rhode Island (Million Cubic Feet) | |||||
| Decade | Year-0 | Year-1 | Year-2 | Year-3 | Year-4 | Year-5 | Year-6 | Year-7 | Year-8 | Year-9 |
|---|---|---|---|---|---|---|---|---|---|---|
| 1980's | -137,224 | |||||||||
| 1990's | -131,255 | -138,751 | -160,560 | -116,522 | -147,451 | -178,207 | -181,290 | -172,204 | -148,952 | -125,883 |
| 2000's | -119,535 | -122,504 | -122,662 | -144,284 | -117,365 | -125,202 | -134,764 | -157,613 | -133,472 | -142,261 |
| 2010's | -138,346 | -153,304 | -177,226 | -178,793 | -197,299 | -200,407 | -162,617 | -214,901 | -210,641 | -223,648 |
| 2020's | -218,399 | -241,034 | -227,293 | -234,161 | -240,048 |
| - = No Data Reported; -- = Not Applicable; NA = Not Available; W = Withheld to avoid disclosure of individual company data. |
| Release Date: 6/30/2026 |
| Next Release Date: 7/31/2026 |