|
Download Data (XLS File) |
|
|||||
|
|||||
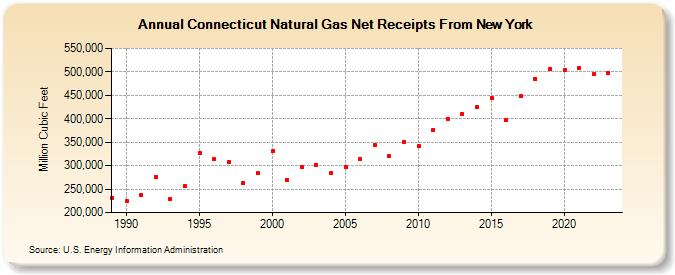
| Connecticut Natural Gas Net Receipts From New York (Million Cubic Feet) | |||||
| Decade | Year-0 | Year-1 | Year-2 | Year-3 | Year-4 | Year-5 | Year-6 | Year-7 | Year-8 | Year-9 |
|---|---|---|---|---|---|---|---|---|---|---|
| 1980's | 231,309 | |||||||||
| 1990's | 224,244 | 236,812 | 276,712 | 228,039 | 256,482 | 326,425 | 313,126 | 306,857 | 262,561 | 283,423 |
| 2000's | 330,903 | 269,788 | 298,181 | 301,004 | 284,289 | 297,797 | 313,246 | 343,980 | 321,534 | 350,684 |
| 2010's | 341,735 | 376,570 | 399,644 | 409,976 | 424,500 | 445,055 | 396,559 | 447,710 | 484,748 | 505,567 |
| 2020's | 503,672 | 507,736 | 494,347 | 497,936 | 514,184 |
| - = No Data Reported; -- = Not Applicable; NA = Not Available; W = Withheld to avoid disclosure of individual company data. |
| Release Date: 6/30/2026 |
| Next Release Date: 7/31/2026 |