|
Download Data (XLS File) |
|
|||||
|
|||||
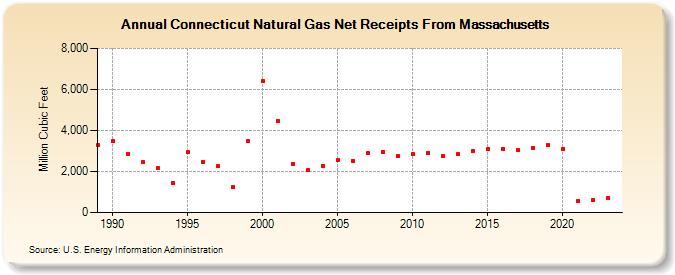
| Connecticut Natural Gas Net Receipts From Massachusetts (Million Cubic Feet) | |||||
| Decade | Year-0 | Year-1 | Year-2 | Year-3 | Year-4 | Year-5 | Year-6 | Year-7 | Year-8 | Year-9 |
|---|---|---|---|---|---|---|---|---|---|---|
| 1980's | 3,284 | |||||||||
| 1990's | 3,480 | 2,878 | 2,449 | 2,165 | 1,447 | 2,936 | 2,458 | 2,257 | 1,228 | 3,465 |
| 2000's | 6,399 | 4,467 | 2,383 | 2,060 | 2,265 | 2,559 | 2,535 | 2,888 | 2,957 | 2,755 |
| 2010's | 2,859 | 2,923 | 2,752 | 2,851 | 2,984 | 3,098 | 3,084 | 3,054 | 3,134 | 3,293 |
| 2020's | 3,095 | 553 | 608 | 715 | 1,031 |
| - = No Data Reported; -- = Not Applicable; NA = Not Available; W = Withheld to avoid disclosure of individual company data. |
| Release Date: 6/30/2026 |
| Next Release Date: 7/31/2026 |