|
Download Data (XLS File) |
|
|||||
|
|||||
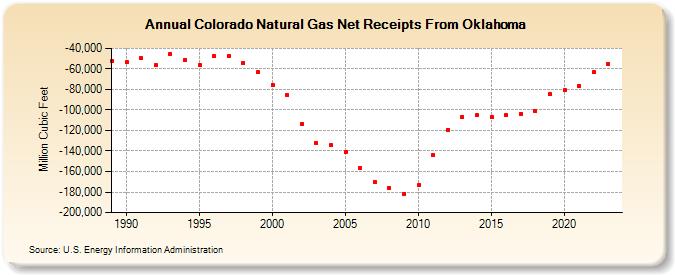
| Colorado Natural Gas Net Receipts From Oklahoma (Million Cubic Feet) | |||||
| Decade | Year-0 | Year-1 | Year-2 | Year-3 | Year-4 | Year-5 | Year-6 | Year-7 | Year-8 | Year-9 |
|---|---|---|---|---|---|---|---|---|---|---|
| 1980's | -52,318 | |||||||||
| 1990's | -53,355 | -49,678 | -56,611 | -45,260 | -51,527 | -56,463 | -47,639 | -47,585 | -53,952 | -63,453 |
| 2000's | -75,416 | -85,387 | -113,443 | -132,118 | -134,579 | -141,296 | -156,669 | -169,975 | -175,773 | -181,542 |
| 2010's | -173,395 | -144,370 | -119,245 | -106,892 | -105,052 | -107,003 | -105,302 | -103,762 | -100,929 | -84,933 |
| 2020's | -80,922 | -76,495 | -63,375 | -55,410 | -72,776 |
| - = No Data Reported; -- = Not Applicable; NA = Not Available; W = Withheld to avoid disclosure of individual company data. |
| Release Date: 6/30/2026 |
| Next Release Date: 7/31/2026 |