|
Download Data (XLS File) |
|
|||||
|
|||||
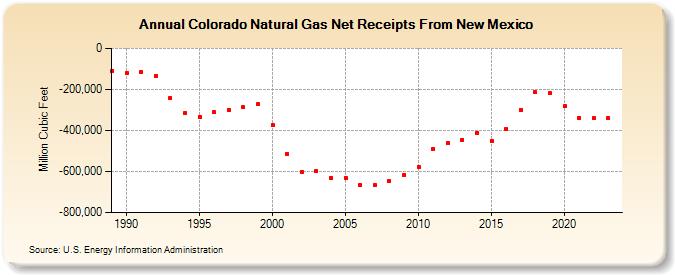
| Colorado Natural Gas Net Receipts From New Mexico (Million Cubic Feet) | |||||
| Decade | Year-0 | Year-1 | Year-2 | Year-3 | Year-4 | Year-5 | Year-6 | Year-7 | Year-8 | Year-9 |
|---|---|---|---|---|---|---|---|---|---|---|
| 1980's | -110,167 | |||||||||
| 1990's | -120,826 | -114,443 | -135,456 | -241,067 | -314,415 | -332,425 | -312,064 | -298,489 | -287,827 | -271,192 |
| 2000's | -373,951 | -514,268 | -600,869 | -598,602 | -629,811 | -629,943 | -665,152 | -666,837 | -648,305 | -614,795 |
| 2010's | -576,634 | -491,294 | -462,284 | -445,201 | -410,673 | -449,651 | -392,737 | -298,237 | -213,771 | -216,746 |
| 2020's | -281,459 | -338,331 | -339,713 | -341,491 | -289,444 |
| - = No Data Reported; -- = Not Applicable; NA = Not Available; W = Withheld to avoid disclosure of individual company data. |
| Release Date: 6/30/2026 |
| Next Release Date: 7/31/2026 |