|
Download Data (XLS File) |
|
|||||
|
|||||
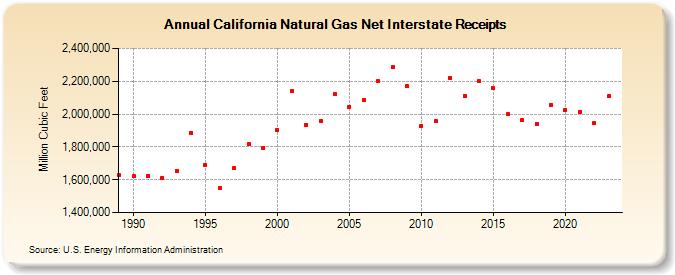
| California Natural Gas Net Interstate Receipts (Million Cubic Feet) | |||||
| Decade | Year-0 | Year-1 | Year-2 | Year-3 | Year-4 | Year-5 | Year-6 | Year-7 | Year-8 | Year-9 |
|---|---|---|---|---|---|---|---|---|---|---|
| 1980's | 1,627,420 | |||||||||
| 1990's | 1,620,132 | 1,623,693 | 1,610,708 | 1,654,143 | 1,887,149 | 1,690,530 | 1,547,503 | 1,671,128 | 1,820,433 | 1,795,215 |
| 2000's | 1,903,653 | 2,143,331 | 1,936,149 | 1,959,883 | 2,121,734 | 2,045,687 | 2,088,119 | 2,199,334 | 2,284,732 | 2,168,199 |
| 2010's | 1,929,693 | 1,954,947 | 2,222,355 | 2,111,671 | 2,200,373 | 2,156,750 | 1,997,329 | 1,962,139 | 1,940,609 | 2,057,263 |
| 2020's | 2,026,822 | 2,014,370 | 1,943,321 | 2,107,544 | 1,913,274 |
| - = No Data Reported; -- = Not Applicable; NA = Not Available; W = Withheld to avoid disclosure of individual company data. |
| Release Date: 6/30/2026 |
| Next Release Date: 7/31/2026 |