|
Download Data (XLS File) |
|
|||||
|
|||||
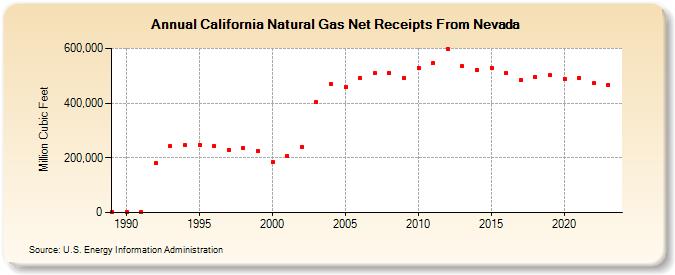
| California Natural Gas Net Receipts From Nevada (Million Cubic Feet) | |||||
| Decade | Year-0 | Year-1 | Year-2 | Year-3 | Year-4 | Year-5 | Year-6 | Year-7 | Year-8 | Year-9 |
|---|---|---|---|---|---|---|---|---|---|---|
| 1980's | 2,556 | |||||||||
| 1990's | 2,548 | 2,230 | 180,832 | 241,471 | 245,519 | 247,692 | 243,866 | 229,779 | 236,624 | 225,138 |
| 2000's | 184,433 | 207,338 | 240,564 | 402,365 | 470,457 | 458,768 | 492,655 | 509,905 | 509,925 | 491,857 |
| 2010's | 529,428 | 545,983 | 598,379 | 534,279 | 522,756 | 530,125 | 510,817 | 485,334 | 495,381 | 501,756 |
| 2020's | 489,453 | 492,956 | 473,466 | 467,268 | 410,176 |
| - = No Data Reported; -- = Not Applicable; NA = Not Available; W = Withheld to avoid disclosure of individual company data. |
| Release Date: 6/30/2026 |
| Next Release Date: 7/31/2026 |